

R Tutorial 12.0
In our last blog, we have covered "How to get Basic Statistics in R", let's now go ahead and learn process of frequency analysis in R and also the Chi-Square test.
The tutorial is quite useful, especially, when you perform a Logistic Regression.
For the purpose of this analysis we would be using an inbuilt data of R "mpg".
Let's first make a data :
Data_1 = mpg[c("cyl","year","class")]
# Let's attach data and then see year wise distribution of Cyl
 attach(Data_1)
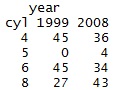
table_1 = table(cyl,year)
print(table_1)
and you get the result like this >>>>>>>>>>>>>>>>>>.
So, it takes the first argument in the "table" function as "Row Labels" and second one as "Column Label" and then gives frequency.
You can try various types of such tables :
table_2 = table(cyl,class)
print(table_2)
or
table_2 = table(year,class)
print(table_2)

margin.table for row/column wise total
Now, if you want to further analyze these resultant tables e.g. You want year wise total or cyl wise total, use margin statement:

margin.table(table_2, 1)
margin.table(table_2, 2)
prop.table for %distribution Analysis
prop.table(table_2, 1) # gives the proportion row wiseprop.table(table_2, 2) # gives the proportion column wise
prop.table(table_2) # gives the proportion in matrix

You can notice that in first result, the summation of proportion across rows are 1 and in the second one summation of proportions across columns is 1. In third one, the summation of all the proportions in the matrix is 1.
The frequency analysis is not limited for 2 variables at a time, you can go n-way.
Let's try a 3 way frequency analysis :
table_3 = table(cyl, year, class)
ftable(table_3) # fttable is used to have a compact view of n-way frequency table

There is one more function "xtabs", that can be used to doing same.
Try this one:
table_4 = xtabs(~cyl+year+class, data = Data_1)
ftable(table_4)
Chi-Square Test in R
Last thing in the Frequency Analysis, that we need to learn is "How to perform a Chi-Square Test ?".
use "summary" function on derived table using table function :
Test Case 1:

print(table_1)
summary(table_1)
we can see that p value is less than generally accepted cut-off 0.05 and hence we can reject the Null Hypothesis of independence of variables year and cyl.
Test Case 2:

table_2 = table(year,class)
print(table_2)
summary(table_2)
Here we fail to reject the Null Hypothesis and can say that variables are independent.
Enjoy reading our other articles and stay tuned with us.
Kindly do provide your feedback in the 'Comments' Section and share as much as possible.
No comments:
Post a Comment
Do provide us your feedback, it would help us serve your better.