R Tutorial 11.0
This tutorial covers various packages/function that help analysts in getting various statistics such as mean, median, quantile, range etc. of a data.
In Tutorial 9.0 (Aggregation of data in R) , we had covered functions aggregate and summarize(Hemisc package), which are used for deriving insight off the data. Let's explore more of these and other functions now.
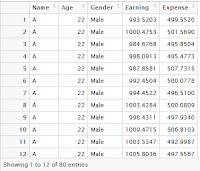
Let's first prepare a data with both numeric and character fields.
rm(list = ls()) # Let's clear work space
Name = c(rep("A",20),rep("B",20),rep("C",40))
Age = c(rep(22,20),rep(23,20),rep(24,40))
Gender= c(rep("Male",20),rep("Female",20),rep("Male",40))
Earning= rnorm(80,1000,10)
Expense = rnorm(80,500,5)
Data_1 = data.frame(Name, Age,Gender, Earning, Expense)
 rm(Name,Age,Gender,Earning,Expense)
** rnorm is a function to create random normally distributed numbers
Now we have our test data, We will now work on it.
1. sapply function
 sapply(Data_1, mean,na.rm= F)
It would give the mean of numeric variables in the data along with the warning message if any it finds any character variables in the data.
sapply(Data_1[c(2,4,5)],mean, na.rm= F)
Now the above code would calculate the mean for only 2nd, 4th and 5th columns. It is advised to give the columns' index, which you want to calculate the mean etc for.
In place of the option "mean"(2nd argument), one can use sd, var, min, max, median, range, and quantile based on requirement.
** sd = standard deviation, var = variance
Example:

2. summary function
The function directly gives minimum, 1st quartile, median, mean, 3rd quartile and maximum of all the columns.
summary(Data_1)
and here is the output in the console:

The "summary" function automatically discriminates between numeric and character variables. For a character variable it gives the frequency of each element and for the numeric variables, it gives minimum, 1st quartile, median, mean, 3rd quartile and maximum value.
3. describe function (Hmisc package)
We had used this package for aggregation using summarize function in one of our previous tutorials Tutorial 9.0 (Aggregation of data in R). describe is also one of the functions available within this package.The function also works in line of summary function, however gives a little extra in the output.
Install the package if not already installed. While you install a packages like this one, there might be other packages bundled up, R installs these packages along with the required one.
#install.packages("Hmisc")
library(Hmisc)
describe(Data_1, exclude.missing=TRUE)
 |
| Click to enlarge |
There are other packages too that can be used for getting basic statistical summary ... It is fine if you become expert in one or two.
4. describe function (psych package)
Try running the code and check the results :install.packages("psych")
library(psych)
describe(Data_1)
The result of the packge would look like :
Rest, you guys are intelligent enough to understand.
The packages also facilitates the "group wise summary" functionality, try this one.

attach(Data_1)
describe.by(Expense,Age)
and it gives result as shown >>
There comes a warning, which says that "describe.by" function is not replaced with "decribeBy". You can start using it now
describeBy(Expense,Age)
The above also gives the same result.
5. stats.desc (pastecs Package)
Try running the code and check the results :install.packages("pastecs")
library(pastecs)
stats.desc(Data_1)
The last package that we are covering is also used for group wise statistical summarization :
5. summaryBy function (doBy Package)
install.packages("doBy")
library(doBy)
# To find mean, even basic syntax can work
summaryBy(Expense~Gender,data=Data_1)
# But if you want more stats, you can customize your results, sd, var, min, max, median, range #can be used
summaryBy(Expense~Gender,data=Data_1, FUN = function(x) {c(m = mean(x), s = sd(x))})
Enjoy reading our other articles and stay tuned with us.
Kindly do provide your feedback in the 'Comments' Section and share as much as possible.


EE6546790F
ReplyDeleteTakipçi Satın Al
İzlenme Hilesi
Cin Fiyatları